Distinct counts can be awesome, but what often remains is the question of dimensionality, especially when it comes to time aggregation. Let’s say we have a shop and we want to know, how many distinct customers we have per day, or how many distinct employees perform a certain task. That’s not hard to implement, thanks to the option of counting distinct values. MicroStrategy will count these distinct values based on whatever dimension we have in the report and return correct numbers.
But what happens, if we need to aggregate these values? We might need the maximum of employees to verify that the licensing is still okay or we might want to create a rolling average of distinct customers. For all this, we need to be able to aggregate these distinct values.
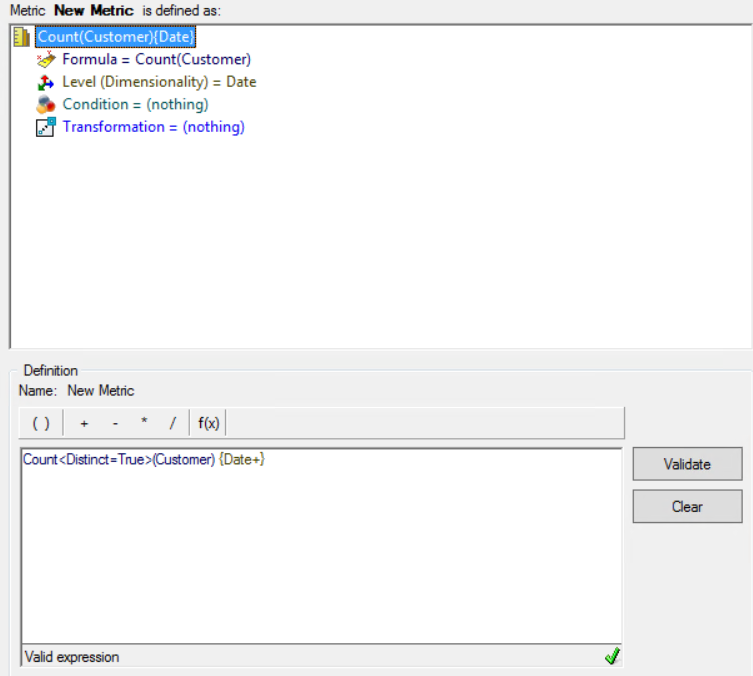
The first thing we’ll be creating is the distinct count metric. In this example I’m counting customers, but of course it works for everything.

The important part here is to change the Level (Dimensionality) to whatever you want to limit the metric to. Most of the time this will be the date, maybe accompanied by shops (for customers) or tasks (for employees). For the sake of simplicity I’ve voted for date only.

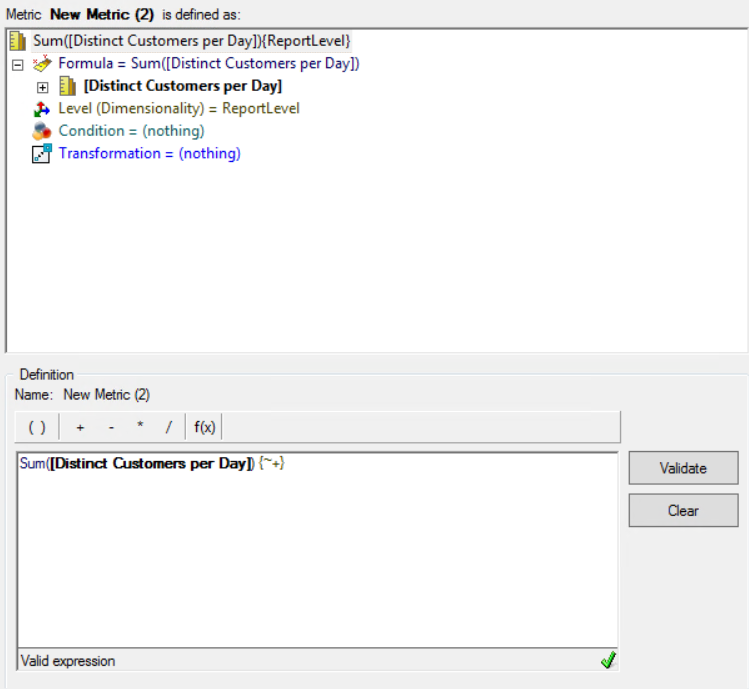
Now that we have our “Distinct Customers per Day” metric, we can go on and build our aggregation metric. I’ve opted for a simple sum, but again, pick what you need. No need to change the level here, because the base metric already takes care of this.

Now if we create a report using this metric and date plus week as dimensions, the following will happen.In a first pass, MicroStrategy will count the distinct customers per day.
Pass1 -
select a11.date_key date_key,
 count(distinct a11.customer_id) distinct_customers_per_day,
into #THWWRNYVZMD000
from fact_visitors a11
 join dim_date a12
 on (a11.date_key = a12.date_key)
where a12.calendar_week_key between 2018001 and 2018003)
group by a11.date_key
In a second pass, it will build the sum per day:
Pass2 -
select pa11.date_key date_key,
 sum(pa11.distinct_customers_per_day) WJXBFS1,
into #T2JXOF5HTMD002
from #THWWRNYVZMD000 pa11
 join dim_date a12
 on (pa11.date_key = a12.date_key)
where a12.calendar_week_key between 2018001 and 2018003
group by pa11.date_key
And in the last pass, the two results are joined together:
Pass3 -
select distinct a13.calendar_week_key calendar_week_key,
 a13.calendar_week_desc calendar_week_desc,
 pa11.date_key date_key,
 a13.date_id date_id,
 pa11.distinct_customers_per_day distinct_customers_per_day,
 pa12.WJXBFS1 WJXBFS1,
from #THWWRNYVZMD000 pa11
 join #T2JXOF5HTMD002 pa12
 on (pa11.date_key = pa12.date_key)
 join dim_date a13
 on (pa11.date_key = a13.date_key)
Truth is, that this kind of measure requires a bit of planning, given that the levels have to be set manually. On the other hand you’re getting a powerful tool to create insights with MicroStrategy, that might otherwise come from helper tables.
And that’s it, not hard at all.