Whenever we come across a report using DAX, we will find that filtering is everywhere. Laugh all you want, but coming from a purely database background, I wasn’t aware what filtering means when I began building models, formulas and reports. For me, filtering was equal to a where clause in an SQL statement and visuals something similar to group by or pivot. One thing before we start: I’m not talking about the internal handling of DAX queries here, I’m just talking about where DAX treats things as filtered.
Let’s have a look at a very simple matrix:
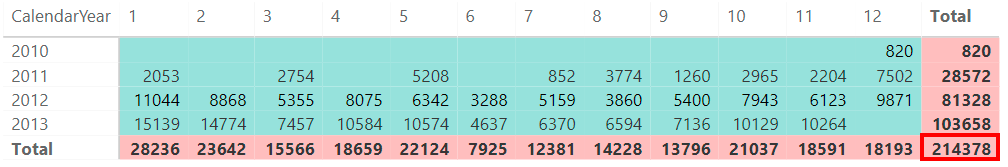
The thing I did not quite understand at the beginning of my DAX career is, that filters are omnipresent here. The values in turquoise are filtered by year and month, the values in red by either month or year. Oh and then there’s the grand total with the red outline. I admit it, there’s no filter at all there. Once I understood this, things became lots easier.
By the way, we can check that by creating two measures that include these filters in the formula.
Orders201303 = CALCULATE(SUM(FactResellerSales[OrderQuantity]),DimDate[CalendarYear]=2013,DimDate[MonthNumberOfYear]=3)

Orders01 = CALCULATE(SUM(FactResellerSales[OrderQuantity]),DimDate[MonthNumberOfYear]=1)
And the result is the following:
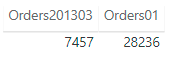
See? Matches exactly the results above.
But why is that so important to keep in mind? For me, it had to do with functions that only work with certain aggregation levels. Because all of these cells are filtered in some way, you can use functions that interact with filters. One example is HASONEFILTER. For the sake of demonstration, we will build a measure that only returns a value if one specific month is filtered. But let’s skip theory and build it:
OrderOneFilter = IF(HASONEFILTER(DimDate[MonthNumberOfYear]);SUM(FactResellerSales[OrderQuantity]);BLANK())Now add this to our matrix and what we get is the following:
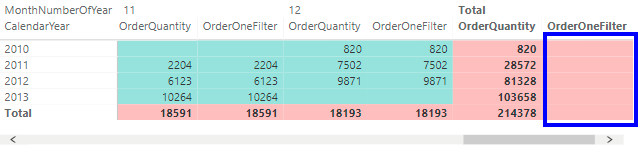
In most cases, our new measure will produce the same result as the old one, but on the row totals, we’re getting a blank. But why?
The reason is rather simple. Our measure checks, down to how many rows the column DimDate[MonthNumberOfYear] is being filtered. Since we’re using it in the columns of the matrix, it’s filtered to one value most of the time, so the condition of HASONEFILTER is met. But when we look at the row totals, we’re filtering the year but we want all months, i.e. 12 rows of MonthNumberOfYear. Given our measure condition, BLANK() is returned.
Using this, it’s easy to create measures that do not return values when any aggregation above day is selected, for instance. It is also important to understand how stacking different aggregations works; a subject I will cover in one of my next articles.